Which goals scored/allowed statistics yield Pythagorean points?
Categories: Soccer Pythagorean: Theory
When I was evaluating last season’s league projections and creating this season’s with the Pythagorean expectation, I was reminded that I hadn’t really studied which pairs of goals scored and allowed result in a specific expected point total. In a league competition, it’s possible to reach a point total in various ways, and the combination of goals scored and allowed doesn’t necessarily follow a straight line.
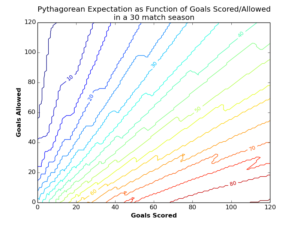
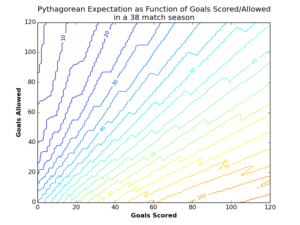
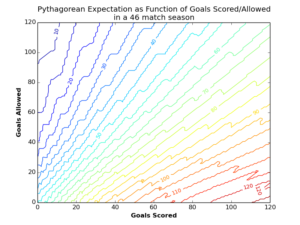
To visualize the Pythagorean points that resulted from a goals scored and allowed combination, I created a contour plot. I considered a wide range of goals scored or allowed — from zero to 120 goals — to ensure that I would cover the theoretical range of league points. Each plot assumes a certain number of matches in a league season, and point totals are for an average team in the league competition. I suppose I could have used point averages from 0 to 3.0 in the contour levels, which would have reduced the plots to one, but in my opinion the contours are more understandable when they relate to numbers that people typically see in a league competition.
So here are the plots, starting with Pythagorean expectations for a 30-match league competition:
Next, a 38-match league competition:
And finally, a 46-match league competition:
I didn’t smooth the contours in the plot, which should explain the jagged look. But you can see hooks in the contours that become more pronounced at the highest expected point totals. I’m not sure what causes those hooks. The contours appear approximately parabolic at low point totals, straighten out to rays at higher point totals, and flatten out and start to lose coherence at extreme point totals. But there are ridges in the contours that also fall along lines in the goals scored/allowed plane. They’re very interesting plots once you start to study them.
The thought didn’t occur to me until I started writing this post, but it would have been useful to overlay straight lines that indicate constant goal difference onto the contour plot. I might go back and insert them in, but my curiosity has taken me far enough.


