A deeper look at effective time in the Premier League
Categories: Match Quality Metrics
Six months ago I brought up the idea of effective time in football and developed an algorithm to calculate it from a technical/tactical data set (aka touch-by-touch data created by companies such as Opta Sports). It’s not a novel concept — RAI would display such a statistic during their Serie A broadcasts in the 1990s, for example — but the algorithm computes effective time more tightly than Opta’s formulation which results in significant differences.
I demonstrated the algorithm on Opta’s 2010-11 English Premier League data set and established that there’s not much of a relationship between effective time and number of possessions, but a stronger one between effective time and match tempo. It’s been a while I analyzed these data, and in this final post of 2013 I return to them and apply the previous work done with J-League data to the Premier League.
I want to answer the following questions that I posed in the J-League data analysis: Is it possible to assess a team’s influence on the amount of playing time in a match from solely their participation in the match? And: If all we know are the two teams involved — and perhaps which one is playing at home — can we predict how much playing time there will be in the match, and if so, how accurate will this prediction be?
The model framework is identical between the two analyses, so I won’t repeat them here. There are more matches played in the Premier League than J-League Divisions 1 or 2, so I can employ an 8-fold cross-validation, but the equivalent six matchdays (60 matches) is reserved to test the fitted model.
The increase in the number of teams — and accordingly the number of matches — increases the coefficient of determination in the Premier League model. Knowledge of the two teams in a Premier League match explains about 40-45% of the variation in effective playing time, but in contrast to the J-League model, the adjusted R² is comfortably in positive territory. However, that term doesn’t mean much without comparison against models that add other terms, such as referee identity, tempo, fouls, or other variables.
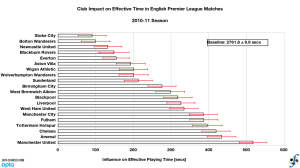
Table 1 displays a chart of each Premier League team’s influence on match time in a league match, along with a standard error of the estimated parameter. Figure 1 visualizes the chart with the error bars included. The estimated baseline playing time of a Premier League match in 2010-11 is 2761.8 ± 9.9 seconds, or 46 minutes 2 seconds. I doubt that few people would be surprised to observe that Bolton and Stoke had the smallest impact on effective time above a mean baseline. On average they would contribute between one to two minutes to the effective match time. The side that had the greatest positive impact on effective playing time in a match were champions Manchester United — eight to nine minutes above an average team in the Premier League. All of the clubs with the five highest impacts on effective time also finished in the top five, with the exception of Fulham, and Manchester City’s impact was virtually identical to Fulham’s. The impact of the relegated teams on effective time — Blackpool, Birmingham City, West Ham — is within mid-range of the Premiership sides.
| Club | EPT Impact (sec) | Std Error (secs) |
| Manchester United | 517.3 | 36.7 |
| Arsenal | 434.2 | 37.7 |
| Chelsea | 419.1 | 37.7 |
| Tottenham Hotspur | 396.0 | 39.4 |
| Fulham | 386.8 | 37.7 |
| Manchester City | 385.6 | 37.7 |
| West Ham United | 334.1 | 37.3 |
| Liverpool | 326.1 | 37.2 |
| Blackpool | 318.1 | 37.8 |
| West Bromwich Albion | 297.7 | 38.3 |
| Birmingham City | 276.1 | 37.2 |
| Sunderland | 213.0 | 37.7 |
| Wolverhampton Wanderers | 201.0 | 38.9 |
| Wigan Athletic | 200.2 | 37.8 |
| Aston Villa | 193.0 | 38.5 |
| Everton | 154.3 | 35.2 |
| Blackburn Rovers | 148.7 | 40.1 |
| Newcastle United | 132.2 | 37.2 |
| Bolton Wanderers | 99.6 | 38.2 |
| Stoke City | 90.4 | 37.2 |

Figure 1. Club influence on effective playing time in English Premier League, 2010-11 season (final).
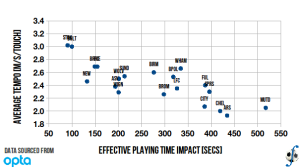
In my post on match tempo I observed a strong correlation between a team’s average tempo and the average minutes of effective play in matches involving that team. I observe the same thing when I plot each team’s impact against averaged tempo (Figure 2). The coefficient of determination between the two variables is R² = 0.65. As in that other post, the club’s impact on the effective time is inversely associated with its tempo. It appears to make intuitive sense; if a club employs a fast-paced style of possession, it is more likely to see the ball out of play more.

Figure 2. Relationship between a club’s influence on effective playing time and average match tempo, English Premier League, 2010-11 season (final).
If you plugged in the impact coefficients for teams, you might be able to predict effective time within 6-8 minutes, and perhaps better than that if the match is not a “2-sigma” event or rarer (this covers about 5% of matches). So when I think of applications…maybe such a model could be used by broadcasting partners or the league office? I haven’t given it much thought and besides you don’t need a regression model to know that Arsenal vs Liverpool is a more appealing match to a neutral than Stoke vs Blackburn or whoever. There is more to match quality than effective playing time, but it does have a role to play. Perhaps there’s not much utility beyond the academic exercise.

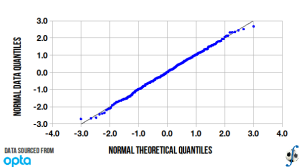
Figure 3. Q-Q plot (normality test) of effective playing time in English Premier League, 2010-11 season (final).
There are several critiques that one could make of this model — and I might agree with most of them! — but among them would be the challenge to the observation that all teams add to the effective match time. I think there is an intuition among football observers that some teams want to increase the amount of time that the ball is in play as part of their game plan, while others seek to reduce it by knocking the ball out of play and drawing set-piece opportunities. Centering the data about the mean effective time in league matches would address that intuition. Adding more regressors (within reason) could help as well. Nevertheless, there will always be an element of a soccer match subject to random events that impact everything, from the amount of time that the ball is in play to the final score. It is interesting to see how far we can get with a basic model.

