Revisiting front-office efficiency in MLS
Categories: Front-Office Efficiency
Last month I wrote on the marginal payroll costs per point earned (which I called “front-office efficiency”) in the 2012 Major League Soccer season. (You can find more details on the approach in the linked post and the articles linked therein.) One of the criticisms of the metric was that it failed to take into account player availability throughout the season. On Twitter I called it “payroll utilization“, and I’ll explain it here.
I define payroll utilization as the player’s salary weighed by the proportion of number of minutes played to the total minutes played by the team. The time period is arbitrary, but for this purpose I define it as the regular season. Over all of the players on a team’s roster, the team’s payroll utilization looks like this:
Here m represents individual minutes played and s the individual salary (the i subscript refers to the ith player), while M represents the total number of minutes played by the team and S the total team payroll.
It’s trivial to point out that the payroll utilization factor can never equal 1.0. Football teams will always have more than 11 players on the squad, and not everyone will play every minute of every match. (Very few players do in fact; only two played all possible team minutes in MLS in 2012.)
The marginal payroll cost per point is computed as before, but we divide the amount by the payroll utilization factor to account for availability of personnel during the season.
My data sources were Aaron Nielsen’s statistical database for MLS as well as the publicly available salary data from the MLS Players Union.
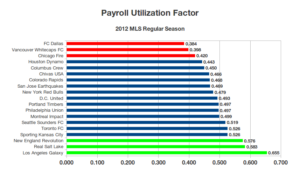
So now let’s show some results. Here’s a chart of the payroll utilization factor for the 2012 MLS regular season:
The average payroll utilization factor in MLS is 0.492, which is just below the four-year league average of 0.52. I was expecting the factor to be somewhere close to 0.50, which would reflect the use of substitution and rotation as well as the impact of unforeseen events such as injuries or suspensions. The teams highlighted in green represent one standard deviation above the mean utilization factor (LA, RSL, and the Revolution), and those highlighted in red are one standard deviation under (Chicago, Vancouver, and FC Dallas).
The second chart is the marginal payroll cost per point earned, divided by the payroll utilization factor to result in the adjusted marginal payroll cost. Teams are ranked by front office efficiency gain. The league median cost per point is $146,375.56, so marginal costs below that amount are considered positive and costs above it are negative.
| Team | Payroll | Points | Payroll Cost/Point | Efficiency |
| Sporting Kansas City | $2,893,657.00 | 63 | $71,538.65 | 51.13% |
| San Jose Earthquakes | $2,878,166.29 | 66 | $75,513.66 | 48.41% |
| Real Salt Lake | $3,206,785.04 | 57 | $83,408.87 | 43.02% |
| New England Revolution | $2,284,905.96 | 35 | $93,934.04 | 35.83% |
| Houston Dynamo | $2,901,166.04 | 53 | $102,573.94 | 29.92% |
| D.C. United | $3,453,679.20 | 58 | $106,678.92 | 27.12% |
| Columbus Crew | $3,111,134.00 | 52 | $115,509.61 | 21.09% |
| Seattle Sounders FC | $3,789,781.00 | 56 | $119,048.54 | 18.67% |
| Chicago Fire | $3,600,214.00 | 57 | $134,896.51 | 7.84% |
| Philadelphia Union | $2,861,006.08 | 36 | $146,375.56 | 0.00% |
| Montreal Impact | $3,453,853.00 | 42 | $155,004.67 | -5.90% |
| Colorado Rapids | $3,111,123.96 | 37 | $168,514.60 | -15.12% |
| Chivas USA | $3,047,728.00 | 30 | $216,902.48 | -48.18% |
| Portland Timbers | $3,776,116.04 | 34 | $228,453.20 | -56.07% |
| Vancouver Whitecaps FC | $4,551,665.96 | 43 | $267,596.71 | -82.82% |
| Los Angeles Galaxy | $10,825,821.00 | 54 | $331,954.11 | -126.78% |
| FC Dallas | $4,865,549.04 | 39 | $339,508.17 | -131.94% |
| New York Red Bulls | $15,814,369.46 | 57 | $638,674.35 | -336.33% |
| Toronto FC | $5,979,467.00 | 23 | $653,412.32 | -346.39% |
If you compare this chart to the one in my previous post, a few teams swapped places but no more than one spot. The big mover was the New England Revolution from 7th to 4th in the list. The adjusted marginal cost per point accounted not only for their small payroll, but also the high level of utilization of the team’s (limited) resources. The Galaxy were a high-cost team, but their high-cost players were on the field much more than any other team in the league. Maybe it made a difference around playoff time. Toronto’s inefficiencies pop out on the chart.
Some caveats are in order: salary data from the Players Union tend to be underreported, not every player who registered minutes was listed in the salary database (about 30 players), there were pool players who were paid by the league, and not every player had a contract for a full season. Despite the imperfect data, the use of payroll utilization appears to give a sharper view of the relationship between payroll and performance.


