What is the expected tenure of drafted MLS players?
Categories: Football Business Analytics
Major League Soccer has employed a series of drafts that distributed players who have signed with the league among its member clubs. There are drafts for college players (mostly), for players who have left the league and come back, and for in-league players left unprotected for an expansion draft. In this post, I focus on those players making their initial entry into the league and ask, “What is the expected tenure of a newly drafted MLS player?”
Tenure, for the purposes of this post, is defined as the number of MLS regular-season match appearances. If a player has entered a match for at least a minute, that counts as a match appearance. One can define tenure as seasons or minutes played. I chose match appearances because it is more granular than seasons and should give similar results as if I chose minutes played. It’s also easier to relate match appearances to seasons, which is what most people think of when they think of tenure. It’s a matter of preference in the end.
To answer the above question I perform a survival analysis on the MLS draft and performance data. Survival analysis is a branch of statistics that seeks to model and analyze time-to-event problems — the expected time to death, failure, or any other singular and significant event. (It can also be a recurring event, but that wrinkle will be put aside for another time.) Most survival analysis involves calculating the probability of the survival times of a population (survival function) or the expected number of failures by a certain point in the timeline (hazard function). Another subarea of survival analysis involves describing or predicting the impact of independent variables on the survival time, and Cox regression and Aalen’s additive models are popular approaches here.
The data used in this analysis are drawn from all players who have participated in either the Inaugural, College, Supplemental, or Super Drafts between 1996 and 2015. In situations where a player has entered a draft multiple times — and this applies to 45 players — only the earliest draft selection is considered. The draft selections are normalized to a 0-to-1 scale by \((i-1)/(N-1)\), where \(i\) is the overall draft position and \(N\) the number of draft selections. Match appearances are taken from the ENB Sports Soccer Player Database. The analysis is carried out with the lifelines package, which is a really nice survival analysis tool in Python.
I should point out that in survival analysis it’s important to identify censored data points — those data points that don’t encounter the event. If we don’t consider them by ignoring them or tossing them out of the dataset, we run the risk of underestimating the expected lifetime. In this study, the censored data are those players who are still active in Major League Soccer. I identify those players through the latest payroll survey from the MLS Players Union.
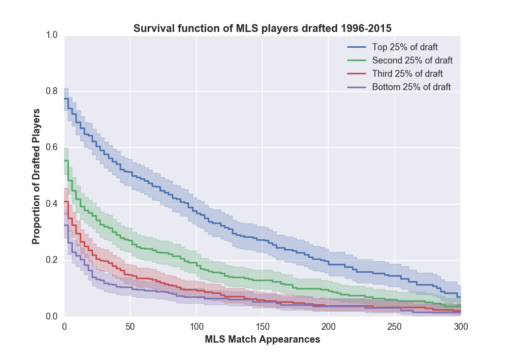
Below are survival curves for all drafted players in Major League Soccer from 1996 to 2015. There are four curves for those players selected in the top 25% of a draft, the second 25%, the third 25%, and the bottom 25% of a draft. The solid line represents the expected probability, and the shaded areas around it represent the 95% confidence interval of the probability.
What the curves are saying is that if you look over the entire history of MLS, the players drafted in the top half of the league are those who you would expect to have long careers in the league, by which I mean 100-150 appearances or more. So I guess you can say that despite some embarrassing incidents, in general the MLS general managers and coaches have been good at identifying top talent. The median tenure for players drafted in the top quarter is just over 50 matches and about a third reach 150 matches. Nevertheless, about 20% of those players drafted in the top quarter of MLS drafts never appear in a league match. For players selected in the second quarter of the draft, about 60% make it inside the white lines; only 33 to 40% of players selected in the lower half of the drafts appear in a league match. By the time those elite MLS players get to 200, 250, or 300+ appearances, it matters less where they started from and more that they survived, but you would still expect those drafted early to make up a good chunk of those survivors.
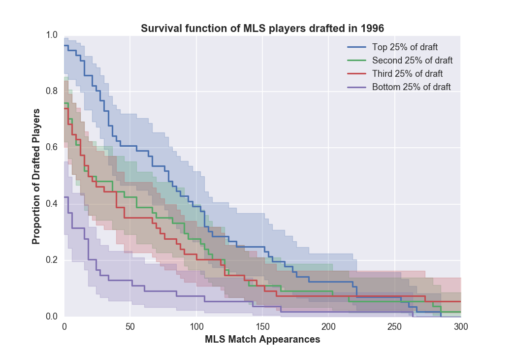
Let’s focus on a specific year, in this case the MLS Draft Originals of 1996. Below is a similar set of survival curves from those draft classes combined (Inaugural, College, and Supplemental).
As you might expect, the confidence intervals are much wider for data drawn from a single year than twenty years. There is some separation between the survival curve for the top quarter of draftees and the other curves until around 100 match appearances. You can see something similar in the survival curve for players drafted in the bottom quarter. What’s different are the curves for players drafted in the middle tier of the draft falling on top of each other. What’s also different this season is that most of the players drafted saw playing time — almost everyone in the top 25% of the draft, almost 80% of those drafted in the middle 50%, and about 40% of those drafted in the lower quarter.
There are some caveats, of course. This is an aggregate survival function of all of those players who entered the league via a draft. I haven’t differentiated between the Inaugural, College, Supplemental, or Super Drafts, and there are significant differences in the survival curves for those drafts. I also haven’t differentiated between primary positions or those who play multiple positions. I’ve also removed any time dependence from the survival curve, which I will want to reinsert to study those draft classes that were either awesome or barren.
I’ll cover some of these topics soon, but for the rest you’ll have to wait until my CASSIS presentation in Vancouver. There’s still time to buy a ticket.


