Referee Performance at the 2018 FIFA World Cup
Categories: Referee Performance
Four years ago I used the occasion of the 2014 FIFA World Cup to write my first articles on referee performance analytics. In the absence of tracking data these analytics have focused more on the management of matches by the 25 center officials than the veracity of in-match decisions or proximity to major events. I’ve written more about referee analytics of other competitions since then, and I’ve repeated the effort for the just-concluded 2018 FIFA World Cup. This World Cup has seen the use of the Video Assistant Referee (VAR) system, but my database does not track VAR reviews, so analysis of VAR is not included here.
For each match I collect the following information:
- Name of referee
- Number of yellow and red (second yellow or direct) cards
- Number of penalties given
- Time added on at end of each period
- Mean time between fouls in each period
- Mean time between stoppages in each period
- Estimate of effective playing time in normal and extra time
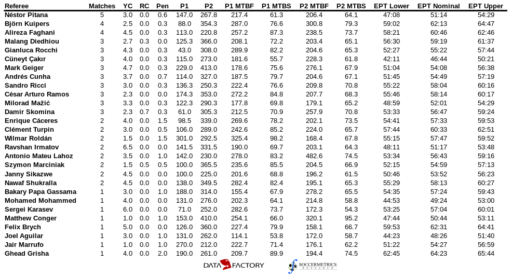
The average of these metrics is calculated over all matches officiated by each of the 28 referees at the World Cup, and those figures are presented in the chart below.

Referee performance during normal time of match officials at the 2018 FIFA World Cup. Data supplied by DataFactory LatAm.
This World Cup was the World Cup of VAR, and its impact appeared to be felt in the refereeing performance statistics. Just four red cards were shown during the tournament — the fewest since the 1978 World Cup — and 219 yellow cards were shown, which was the second-fewest since the World Cup was expanded to 32 finalists. Twenty-nine penalties were given, of which 11 were the result of a VAR review. The significant difference between the amount of stoppage time given in the first and second halves has been seen before, but it’s really something to notice. Almost three more minutes were added at the end of the second half than the first! On average, the mean times between stoppages and fouls were stable between halves, and the effective playing time was in the 52-58 minute range, which is within the range observed for top-flight football matches.
Néstor Pitana, who refereed the World Cup Final, officiated the most matches. He became known as a referee who was willing to give penalties (he gave a very controversial penalty after VAR review during the Final), but showed relatively few yellow cards and called fouls at a consistent rate. However, during both periods of normal time the mean time between stoppages was the second-lowest of the 20 referees who worked more than one match, and the average effective playing time was lower than any other referee save one (Cüneyt Çakır). Were these numbers a result of being given more contentious or high-stakes matches? Maybe, maybe not. Pitana was given two group stage matches and three knockouts; Çakır worked two group stage matches and the England-Croatia semifinal, and many of his metrics were “worse” than Pitana’s.
Mark Geiger, who is the highest-profile referee in Major League Soccer, received considerable criticism for his handling of the England-Colombia round of 16 match. Much of the criticism centered around the apparent loss of control of the match and unwillingness to book players, but on average and considering only those referees who worked more than one match, Geiger gave more yellow cards per match than almost all of his counterparts (Ravshan Irmatov showed more) and had the second-lowest mean time between fouls in the first half (Milorad Mažić). Geiger did have the third-largest difference between first and second half mean time between fouls (only exceeded by Antonio Mateu Lahoz and Wilmar Roldán) and added on the most time at the end of the first and second halves. Was the massive amount of time added on because of his extended conversations with protesting players or his use of VAR?
There were five matches that went to extra time at the World Cup. Below are the referee performance metrics during the extra time periods of those matches (disciplinary cards and referee calls are for the entire match).

Referee performance during extra time of match officials at the 2018 FIFA World Cup. Data supplied by DataFactory LatAm.
Extra time matches were handled uniquely by the five referees who worked them. Some had very little stoppage time added with infrequent stops, while others saw a large amount of time added on during periods with a large number of stops and starts. I’m not sure that some of the figures are right — the MTBF figures in the 3rd period (first extra time period) look very off.
Data used for this article have been supplied by DataFactory Latinoaméricano.

