Assessing the Projections: 2015-16 Dutch Eredivisie
Categories: League Competitions
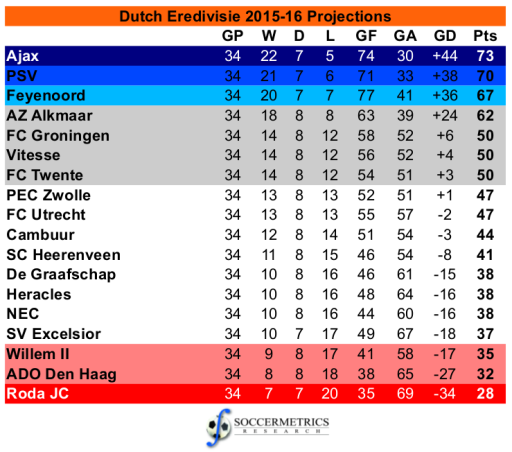
The 2015-16 Dutch Eredivisie, won by PSV, concluded last month. I made a preseason projection of the league in August, and it’s time to revisit it.
Here’s the projection that I made:
And here’s the reality:
| Pos | Team | Pld | W | D | L | GF | GA | GD | Pts |
| 1 | PSV Eindhoven | 34 | 26 | 6 | 2 | 88 | 32 | 56 | 84 |
| 2 | Ajax | 34 | 25 | 7 | 2 | 81 | 21 | 60 | 82 |
| 3 | Feyenoord | 34 | 19 | 6 | 9 | 62 | 40 | 22 | 63 |
| 4 | AZ | 34 | 18 | 5 | 11 | 70 | 53 | 17 | 59 |
| 5 | Utrecht | 34 | 15 | 8 | 11 | 57 | 48 | 9 | 53 |
| 6 | Heracles Almelo | 34 | 14 | 9 | 11 | 47 | 49 | -2 | 51 |
| 7 | Groningen | 34 | 14 | 8 | 12 | 41 | 48 | -7 | 50 |
| 8 | PEC Zwolle | 34 | 14 | 6 | 14 | 56 | 54 | 2 | 48 |
| 9 | Vitesse | 34 | 12 | 10 | 12 | 55 | 38 | 17 | 46 |
| 10 | NEC | 34 | 13 | 7 | 14 | 37 | 42 | -5 | 46 |
| 11 | ADO Den Haag | 34 | 10 | 13 | 11 | 48 | 49 | -1 | 43 |
| 12 | Heerenveen | 34 | 11 | 9 | 14 | 46 | 61 | -15 | 42 |
| 13 | Twente | 34 | 12 | 7 | 15 | 49 | 64 | -15 | 40 |
| 14 | Roda JC Kerkrade | 34 | 8 | 10 | 16 | 34 | 55 | -21 | 34 |
| 15 | Excelsior | 34 | 7 | 9 | 18 | 34 | 60 | -26 | 30 |
| 16 | Willem II | 34 | 6 | 11 | 17 | 35 | 53 | -18 | 29 |
| 17 | De Graafschap | 34 | 5 | 8 | 21 | 39 | 66 | -27 | 23 |
| 18 | Cambuur | 34 | 3 | 9 | 22 | 33 | 79 | -46 | 18 |
As with these other league projections, predicting the goals right goes a long way toward getting the predicted point totals right. Of course, this is a difficult task to do before the season starts.
Even so, the projection identified the top four in the championship and a big gap between them and the rest of the Eredivisie. That’s exactly how the league turned out — there was a smaller gap between AZ and fifth-placed Utrecht, but it was still six points. In general the league projection tightens the difference between the top teams (something similar happens among the teams at the bottom), so Feyenoord were expected to be closer to the Ajax/PSV duopoly than they actually were. For the most part, teams that ran well ahead of their projected defensive performance, such as Heracles, Utrecht, NEC, Den Haag, and Roda JC, overperformed in terms of points and final league position. Only Vitesse allowed 10+ fewer goals than projected and finished with fewer points than expected. As with other projections, relegated teams end up performing much worse than expected (often they’re expected to finish mid-table), and Cambuur was no exception.
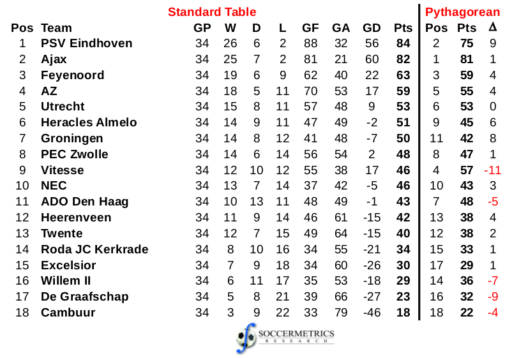
If we had predicted the offensive and defensive goal statistics perfectly, the expected point totals might look something like this:
This table would have produced Ajax as champions, PSV six points back, Vitesse firmly in the European playoff, and Cambuur relegated. Well, one of those things turned out correct. The biggest overperformers in the competition, according to their Pythagorean expectation, were PSV, Heracles, and Groningen. The biggest underperformers? The sides that ended up relegated or forced into the relegation playoffs such as Willem II, De Graafschap, and Cambuur, a middling Den Haag, and a Vitesse that should have contended for European competition. I’ll leave it to regular observers of the Eredivisie to conclude if those assessments are accurate, but this season review by Football Oranje indicates that there may be a nugget or two of truth. It is a refreshing change to see PSV snatch a league title from another club that probably should have won it.
| Total Goals | Pred Goals | Pct Change | RMSE Pts | RMSE GF | RMSE GA | RMSE Pos |
| 912 | 958 | -4.80% | 10.09 | 9.81 | 11.84 | 3.9 |


